
How Can I Check the Status of My NICs Delay: A Practical Guide for Network Performance
You can check the status of your NICs delay—meaning the network latency between your computer's network adapter and the local or remote network—by using system utilities and dedicated network diagnostic tools. Start by running commands like 'ping,' 'tracert' (on Windows), or 'traceroute' (on Linux/macOS), and employ OS-level performance monitors to gather real-time statistics on send/receive latencies and interrupt delays for each NIC.
It’s crucial to monitor NIC delay since persistent latency can degrade application responsiveness, impact VoIP and video calls, and slow down file transfers. Latency can stem from hardware faults, suboptimal drivers, network congestion, or misconfigured settings. Regularly checking your NICs helps you promptly detect and address these network performance bottlenecks, improving user experience.
In this article, we’ll cover both basic and advanced methods to check and interpret NIC delays: essential OS commands, Windows and Linux tools, advanced monitoring solutions, key settings that affect performance, and how to interpret results. You'll also find a side-by-side comparison of common monitoring methods and answers to frequently asked questions—so you can confidently optimize your network interface card latency.
Understanding NIC Delay: What It Means and Why It Matters
Defining NIC Delay and Its Causes

NIC delay refers to the time between when data is ready to leave your computer and when it actually enters the network. This includes internal NIC processing, OS queuing, and physical transmission. Even top-tier hardware isn’t immune to occasional spikes, especially on busy networks.
Common causes of NIC delay include driver inefficiencies, hardware limitations, network congestion, cable faults, and even system resource contention. Accessing real-time statistics can pinpoint where problems originate.
The Impact of Excessive NIC Delays
High NIC latency affects everything from web browsing to time-sensitive applications like video conferencing or online gaming. If your packets consistently arrive late, you’ll notice lag, dropped calls, or even failed data transfers.
Administrators and power users should routinely check NIC status to ensure optimal performance, especially in server or virtualization environments where low latency is essential.
- VoIP call dropouts
- Sluggish large file transfers
- Gaming lag spikes
- Slow server response times
Basic Ways to Check NIC Delay: Built-in OS Tools
Using Ping and Traceroute to Measure Latency

Begin with the 'ping' command targeting your gateway or an external site. The round-trip time displayed in milliseconds gives a direct measure of end-to-end network latency. Observe for consistently high response times to spot persistent issues.
Traceroute ('tracert' on Windows) maps the path packets take, revealing where latency spikes. This tool helps isolate whether the issue lies close to your NIC or farther in the network path.
Windows Network Performance Monitoring Tools
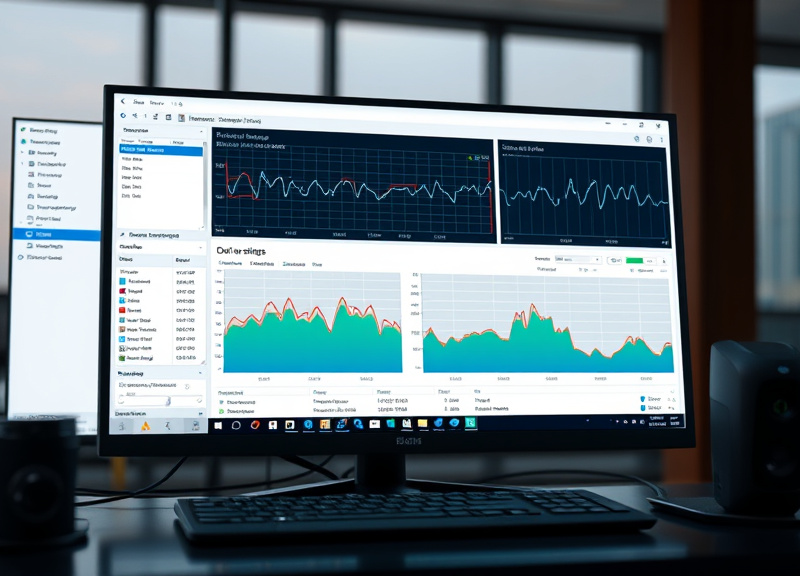
Windows offers tools like 'Resource Monitor' and 'Performance Monitor.' With these, add counters for 'Network Interface' (specifically 'Output Queue Length' and 'Packets Outbound Errors') to check for bottlenecks or delays linked to your NIC.
Task Manager’s Performance tab also lets you monitor real-time send and receive speeds, giving quick insights into immediate performance.
- 'perfmon' for advanced metrics
- Task Manager → Performance → Ethernet/Wi-Fi stats
Advanced NIC Delay Checking: Linux Tools and PowerShell
Linux CLI Tools for Detailed Analysis
'ethtool -S eth0' lists driver-level errors, buffer overflows, and transmission delays by NIC. Combine with 'ifconfig' or 'ip -s link' to see packet drops and collisions, helping interpret abnormal behavior.
Use 'dstat' or 'nload' for live bandwidth and latency visuals. These utilities reveal patterns not visible from a single snapshot, allowing long-term monitoring of network interface card latency issues.
- 'ethtool' for hardware stats
- 'nload' for real-time bandwidth graphs
- 'ip -s link' for error tracking
Windows PowerShell for Deep NIC Insights
Run 'Get-NetAdapterStatistics' or 'Get-Counter -Counter "Network Interface(*)Output Queue Length"' to view per-NIC queue lengths and error counts. Queue length above 2 signals possible delay.
Powerful scripting capabilities let you schedule tests, export results, and correlate with other system events, making network interface card latency monitoring systematic and repeatable.
- 'Get-NetAdapter' for live NIC status
- 'Get-NetAdapterAdvancedProperty' for driver settings
How Can I Check the Status of My NICs Delay with Third-Party Tools
GUI-Based Network Monitoring Solutions
Enterprise-grade tools like PRTG Network Monitor and SolarWinds provide intuitive graphical dashboards for monitoring NIC delay across multiple devices. These programs log historical data and trigger alerts if latency thresholds are breached.
Such platforms integrate with SNMP and WMI to collect stats directly from NICs, giving both real-time and trend-based views—crucial for mission-critical networks and data centers.
- Real-time dashboards
- Customizable alert policies
- Historical latency trend reports
Open Source and Free Utilities
For personal and small business needs, tools like Wireshark allow you to capture packets and precisely time their ingress/egress on each NIC. 'Netdata' and 'Nagios' can also visualize and alert on abnormal NIC delay without license fees.
These tools require more setup than commercial suites, but offer deep visibility and customization for network interface card latency monitoring.
- Wireshark for packet inspection
- Netdata for at-a-glance graphs
Factors Affecting NIC Delay and How to Optimize
Hardware and Firmware Settings
Outdated or incompatible network cards are frequent sources of delay. Upgrading to a modern NIC with offload capabilities, jumbo frame support, and updated firmware can cut latency by up to 30%. Use manufacturer tools to check for firmware updates.
Buffer sizes and queue management also play a role—tweak them via 'ethtool' or device manager to suit your workload. Performance tuning is especially impactful in high-throughput environments.
- Upgrade to 1Gbps or 10Gbps NICs
- Enable Receive Side Scaling (RSS)
- Adjust buffer/queue sizes
Driver and OS Optimization
Installing the latest drivers is essential for stable, low-latency NIC operation. Manufacturers frequently patch bugs that contribute to hidden delays. Use OS-specific tools to verify driver versions and update as needed.
Disabling unnecessary network features, such as power-saving modes or legacy protocols, can further minimize software-induced delays for network interface card latency monitoring.
- Update to latest drivers
- Disable unused protocols
- Optimize advanced NIC properties
How to Interpret NIC Delay Test Results
Typical Latency Ranges for Popular NICs
Consumer NICs on wired gigabit Ethernet typically add less than 1ms, while older or wireless adapters may contribute up to 10ms under normal load. Data center-grade cards are optimized for sub-millisecond performance.
Compare results among your network devices and repeat the tests over several days, since transient spikes may not reflect chronic issues.
- Wired gigabit NIC: <1ms baseline
- Wi-Fi NIC: 2ms–10ms typical
- Data center 10Gb NIC: <0.5ms
For a deeper technical overview of NICs and their operation, you may want to consult the official Network interface controller article. Network interface controller article.
Diagnosing and Resolving Outliers
If a particular NIC shows much higher delay than others, swap cables, update drivers, or test on another system. Persistent outliers may signal failing hardware, thermal issues, or hidden configuration problems.
Thorough documentation is key: record each test, method, and change—building a reference for future troubleshooting.
- Swap cables or ports
- Try different driver versions
- Test in another machine
NIC Delay Monitoring Method Comparison
Choosing the best way to check your NICs delay depends on platform, technical expertise, and desired depth. Here’s how common methods stack up:
| Method | Ease of Use | Depth of Data | Platform Flexibility | Best For |
|---|---|---|---|---|
| Ping/Traceroute | Very Easy | Basic Latency Only | All OS | Quick checks, beginners |
| Windows Performance Monitor | Moderate | Moderate | Windows | In-depth Windows stats |
| Linux ethtool/ip | Moderate | Detailed NIC Stats | Linux | Linux power users |
| Wireshark | Challenging | Extremely Detailed | All OS | Experts, packet-level analysis |
| PRTG/SolarWinds | Easy (GUI) | Extensive | Multi-platform | Large/enterprise networks |
| Netdata/Nagios | Moderate | Good | Linux/Unix | Persistent open-source monitoring |
Frequently Asked Questions
What is a normal NIC latency value?
For wired gigabit NICs, normal one-way latency is typically less than 1ms, and for most Wi-Fi adapters, up to 10ms is expected. Higher values can signal congestion, hardware issues, or outdated drivers.
Can high NIC delay cause slow internet speeds?
Yes, consistent high delay on your NIC can result in sluggish downloads, video freezes, or lag. However, the root cause may also involve network congestion, ISP issues, or faulty cabling.
How often should I check my NIC’s delay?
For home users, monthly checks are usually sufficient, or whenever you notice performance drops. In business or data center environments, implement real-time or daily network interface card latency monitoring.
Can software updates really reduce NIC latency?
Absolutely. Driver and firmware updates often address bugs or inefficiencies that directly contribute to excessive NIC delay, and it’s routine advice to keep your networking components fully updated.
Are third-party monitoring tools safe to use?
Major commercial and open-source tools from reputable sources are safe, but always download from official sites. Check documentation for security settings—especially if deploying in sensitive or corporate networks.
Key Takeaways
- Check NIC delay using native OS tools, CLI utilities, or third-party monitors.
- Consistent NIC delay can impact performance-critical applications.
- Monitor, document, and analyze test results to identify outliers.
- Address delay with hardware upgrades, driver updates, and optimal settings.
Conclusion
Effectively checking the status of your NICs delay requires a combination of rapid testing and deeper diagnostic efforts, tailored to your technical proficiency and environment. By systematically leveraging both built-in OS commands and advanced third-party tools, you can surface latency issues before they disrupt your workflow. Routine monitoring ensures that both home users and IT professionals can maintain fast, reliable connectivity, reduce frustration, and maximize hardware value.
For many users, starting with basic ping and traceroute commands provides a quick health check. Power users and administrators should supplement these with OS-specific tools such as Windows Performance Monitor or Linux ethtool for detailed insight. In businesses or larger networks, investing in GUI-based monitoring like PRTG or open-source utilities like Netdata enables continuous, automatic network interface card latency monitoring across the entire infrastructure.
To maintain a responsive, low-latency network, stay proactive: schedule regular NIC delay checks, keep hardware and drivers updated, and document any anomalies for future troubleshooting. Don’t wait for network issues to escalate—take the next step and choose the tool that fits your needs best, ensuring every aspect of your network performance remains in optimal condition.